“The seasonally bullish Santa Claus rally continues through the second trading day of the new year. ”
The stock market, as measured by the S&P 500 Index
SPX,
has continued to move higher over the past week — ignoring the one big down day (70 points) and putting that in the rearview mirror. SPX has made new 2023 highs, and the all-time highs just above 4800 are within shouting distance.
It seems inevitable that SPX will achieve new all-time highs early in the new year (if not before). The advance has been swift, not leaving much in the way of support. The last time there was any backing and filling (which creates support) was just below 4600, in late November and early December. In theory, a pullback towards that area would still leave the SPX chart interpretation as “bullish.” However, a break below the December lows at 4550 would have far more negative ramifications.
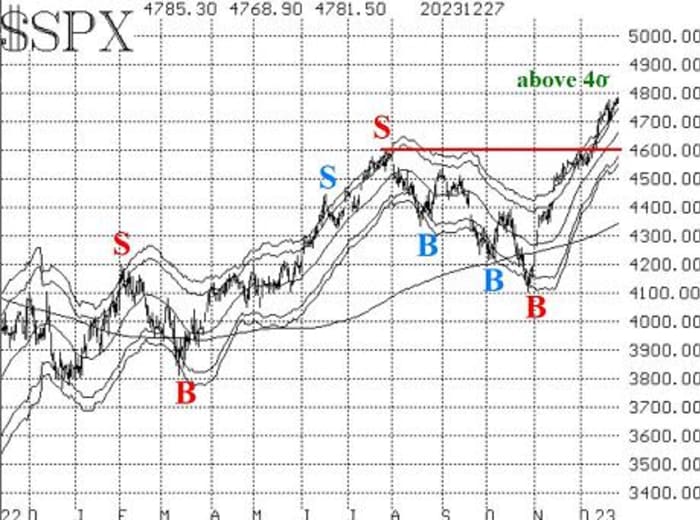
This week, SPX rose back above its 4σ “modified Bollinger Band” (mBB) again. That cancels out the previous “classic” mBB sell signal, and the whole process of potentially setting up a sell signal must begin again. We do not trade the “classic” sell signals. Rather, we wait for further confirmation in the form of a McMillan Volatility Band (MVB) sell signal.
In December we have had two “classic” sell signals so far, but neither one became an MVB sell signal. Both were eventually stopped out when SPX rose back above the +4σ Band. So, now we await a third “classic” sell signal, and we will have to see if it can become a full-fledged MVB sell signal. That “classic” sell signal will occur when SPX closes below its +3σ Band. That would occur on a close below 4758. The +3σ Band moves daily, so that price of the “classic” sell signal will change tomorrow and on subsequent days. Eventually, the “classic” sell signal will occur. After it does, we will outline the parameters for potentially taking a bearish position if the MVB does indeed follow.
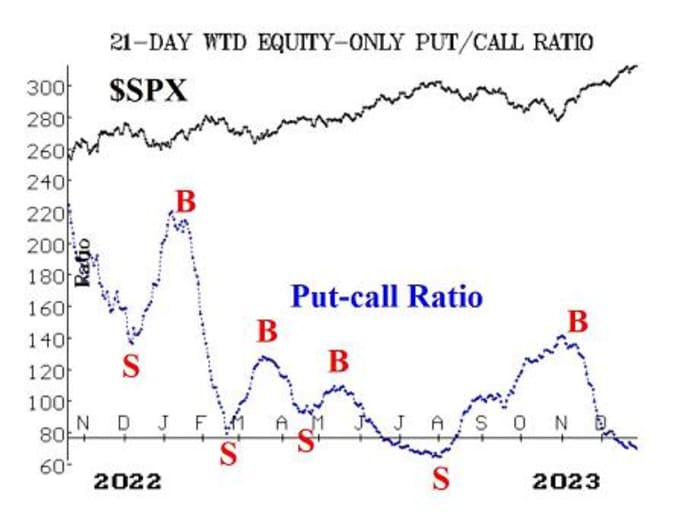
Equity-only put-call ratios have both made new relative lows. That means they remain bullish on the stock market. The standard ratio has been steadily declining. The weighted ratio had a brief rise, during which the computer analysis programs were warning of a sell signal, but action this week has pushed the weighted ratio to a new relative low as well. So, these ratios will remain on buy signals until they roll over and begin to trend upward.
Breadth has been extremely strong over the past week, and the breadth oscillators remain on buy signals. They are in overbought territory. In fact, the “stocks only” breadth oscillator traded at a new all-time high this week. The NYSE breadth oscillator is nowhere near an all-time high. It would probably take three days of negative breadth to roll these breadth oscillators over to sell signals.
In a related matter, cumulative volume breadth (CVB) continues to make new all-time highs as well. That portends well for stocks, and we are holding a long position because of it. CVB is the running daily sum of volume on advancing issues, minus volume on declining issues. The companion indicator — cumulative breadth, which is the running daily sum of the number of advancing issues, minus the number of declining issues — is nowhere near its all-time high, set in November 2021. So, volume has been the key to the rise in the last 15 months, more so than the number of issues rising.
The number of New Highs on the NYSE continues to dominate the number of new lows. That keeps this indicator bullish. This buy signal will be stopped out if, on the NYSE, New Lows outnumber New Highs for two consecutive days.
VIX
VIX
VX00,
continues to hover at low levels. Yes, there was a minor advance last week, when stocks sold off sharply in one day, but that is no longer a factor. The trend of VIX buy signal remains in place. It would be stopped out if VIX were to close above its declining 200-day Moving Average. In addition, we would be concerned if VIX were to return to “spiking” mode (a close at least 3.00 points higher over an 3-day or shorter time period). That hasn’t happened, either.
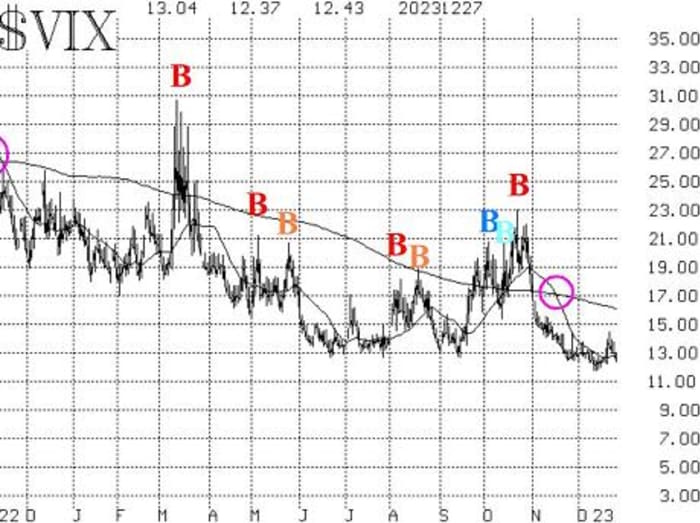
The construct of volatility derivatives remains bullish in its outlook for stocks, since the term structures of the VIX futures and of the CBOE Volatility Indices continue to slope upward. We continue to watch the front-month Jan VIX futures versus the Feb VIX futures to see if an inversion (Jan trading above Feb) takes place. If that were to happen, it would be a negative warning sign, but it doesn’t appear to be a problem at this time.
While we are on the subject of volatility, realized volatility is coming into play. The 20-day historical volatility (HV20) of SPX had dropped almost to 7% recently; it has begun to rise, though, and if it closes above 10%, that is a sell signal for the stock market. This indicator is rarely used, and it is usually an early warning sign of trouble. So, we are keeping an eye on this as well.
The seasonally bullish Santa Claus rally continues through the second trading day of the new year. It is the third and final bullish seasonal that follows Thanksgiving. This year has been one of the stronger ones for that seasonality. We will exit positions based on that, at the close of the second trading day of 2024.
In summary, we continue to maintain a “core” bullish position because of the positive SPX chart. We will trade other confirmed signals around that. We are rolling calls up as they become fairly deep in-the-money — a strategy which brings in credits and reduces downside risk while still allowing for further upside gains.
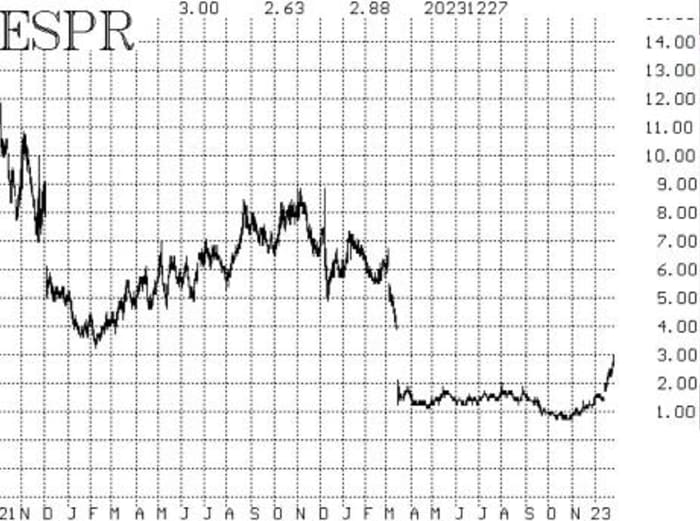
New Recommendation: Esperion Therapeutics (ESPR): This stock has moved higher after building a base for about eight months. Both option and stock volume patterns are strong.
Buy 10 ESPR
ESPR,
Feb (16th) 3 calls in line with the market.
ESPR: 3.06 Feb (16th) 3 call: 0.60 bid, offered at 0.70
If bought, stop out on a close below 2.25.
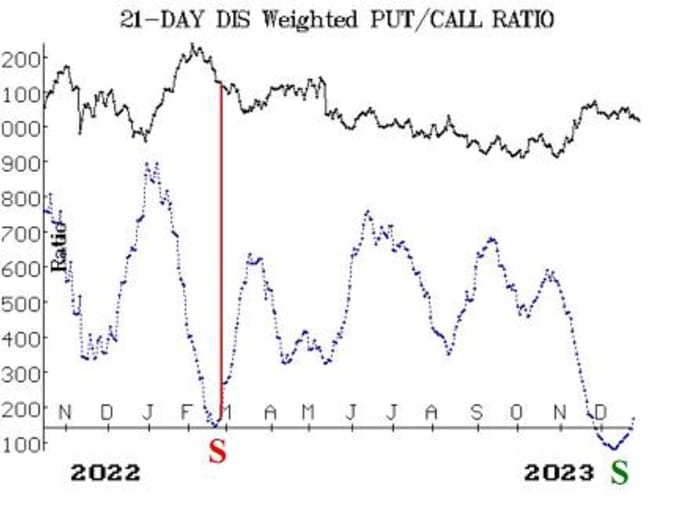
New recommendation: Walt Disney (DIS) Puts: There is a new put-call ratio sell signal in DIS
DIS,
and with the stock breaking down below 91, there is technical confirmation as well.
Buy 2 DIS June (21st) 90 puts in line with the market.
DIS: 90.65 June (21st) 90 puts: 5.40 bid, offered at 5.50
We will hold these puts as long as the weighted put-call ratio of DIS is on a sell signal.
New recommendation: Potential MVB sell signal: This recommendation was not filled last week, and now SPX has risen back above the +4σ Band. So, the entire process of having to set up a sell signal must begin again.
Follow-up action:
All stops are mental closing stops unless otherwise noted.
We are using a “standard” rolling procedure for our SPY spreads: in any vertical bull or bear spread, if the underlying hits the short strike, then roll the entire spread. That would be roll up in the case of a call bull spread or roll down in the case of a bear put spread. Stay in the same expiration and keep the distance between the strikes the same unless otherwise instructed.
Long 1 expiring SPY
SPY
Dec (29th) 472 call: A spread was bought in line with the CBOE equity-only put-call ratio buy signal. It has been rolled up several times, with December 14th being the most recent, when SPY first traded at 472. Roll to the SPY Jan (19th) at-the-money call. We are holding without a stop for now.
Long 2 ES
ES,
Jan (19th) 60 calls: We will hold this position as long as the weighted put-call ratio chart for ES remains on a buy signal.
Long 4 expiring XLP
XLP
Dec (29th) 70 calls: Roll to the Jan (19th) 72 calls. The stop remains at 70.00.
Long 1 expiring SPY Dec (29th) 473 call: This position was initially a long straddle. It was rolled up, and the puts were sold. The calls were rolled up again on December 14th. Continue to roll the call up if it becomes 8 points ITM. Roll to the SPY Jan (19th) at-the-money call. This is, in essence, our “core” bullish position.
Long 5 AVPT
AVPT,
Jan (19th) 8 calls: The stop remains at 8.10.
Long 2 TECH
TECH,
Jan (19th) 70 calls: We will hold as long as the weighted put-call ratio is on a buy signal.
Long 2 IWM
IWM
Jan (19th) 196 calls: This is our post-Thanksgiving seasonal position. We will hold without a stop, since this is a rather long seasonal bullish period extending through the first two trading days of 2024 (the last part of which begins at Thursday’s close). We have rolled the call up three times, most recently on December 14th. Roll up again if the call becomes six points in-the-money (i.e., at 202).
Long 1 SPY Feb (16th) 457 call and short 1 SPY Feb (16th) 477 call: This spread is based on the “New Highs vs. New Lows” buy signal. We will stop out of this position if New Lows on the NYSE exceed New Highs for two consecutive trading days. Otherwise, there is no price stop based on SPX. Roll this spread up 20 points on each side to the Feb (16th) 477-497 call bull spread.
Long 4 UNM
UNM,
Mar (15th) 45 calls: We will hold this position as long as the weighted put-call ratio of UNM remains on a buy signal.
Long 2 SPY Jan (5th) 172 calls: This is our position to trade the Santa Claus rally. Roll the position up if the calls become at least six points in-the-money at any time. Sell the entire position at the close of trading on the second trading day of 2024 — Wednesday, January 3rd.
Long 1 SPY Feb (16th) 480 call: This call was bought in line with the Cumulative Volume Breadth (CVB) buy signal. The entire premium is at risk here, since there really isn’t a stop-out for this trade.
All stops are mental closing stops unless otherwise noted.
Send questions to: lmcmillan@optionstrategist.com.
Lawrence G. McMillan is president of McMillan Analysis, a registered investment and commodity trading advisor. McMillan may hold positions in securities recommended in this report, both personally and in client accounts. He is an experienced trader and money manager and is the author of the best-selling book, Options as a Strategic Investment. www.optionstrategist.com
©McMillan Analysis Corporation is registered with the SEC as an investment advisor and with the CFTC as a commodity trading advisor. The information in this newsletter has been carefully compiled from sources believed to be reliable, but accuracy and completeness are not guaranteed. The officers or directors of McMillan Analysis Corporation, or accounts managed by such persons may have positions in the securities recommended in the advisory.