“Market-timers can’t get much more bullish, which is bearish from a contrarian stance.”
The stock market’s rally has lost almost all support from contrarian analysis. That’s because most of the cash in equity portfolios that used to be sitting on the sidelines is now back in the market, leaving little additional sideline cash available to invest and propel prices much higher in coming months.
Indeed, many of the short-term stock market timers my auditing firm monitors are more bullish today than at almost any other time since data began being collected in 2000.
Consider those timers that focus on timing the broad market, as represented by market averages such as the Dow Jones Industrial Average
DJIA
and the S&P 500
SPX.
Their average recommended equity exposure level currently is higher than in just 0.7% of the trading days since 2000. The timers can’t get much more bullish than that, which is bearish according to contrarian analysis.
The timers’ bullishness is illustrated in the chart below, in which the timers’ average recommended equity exposure level is represented by the Hulbert Stock Newsletter Sentiment Index (HSNSI). The shaded zone at the top of the chart reflects the range of HSNSI readings that are in the top 10% of their distribution since 2000; in previous columns I have used that zone to indicate excessive optimism.
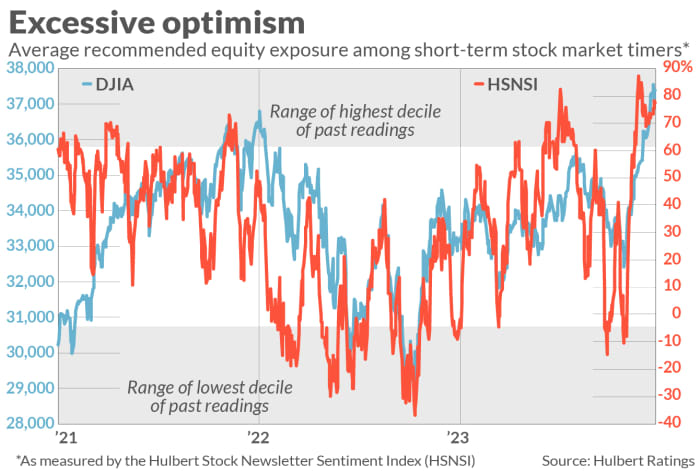
You will notice that the HSNSI entered this top decile zone more than a month ago and, contrary to contrarians’ expectations, the stock market continued to rise. One possible explanation for this surprising strength is that certain other market timers — those who focus on the Nasdaq market in particular — remained much less optimistic. In retrospect, these timers’ relative caution may have been enough to give the rally room to run.
As recently as mid-December, for example, my firm’s Hulbert Nasdaq Newsletter Sentiment Index (HNNSI), which reflects these Nasdaq-focused timers’ average recommended equity exposure, was solidly in the middle of its historical distribution. That no longer is the case: The HNNSI now stands at the 92nd percentile of its historical distribution, joining the HSNSI in their respective zones of excessive optimism. (The HNNSI is not plotted in the accompanying chart.)
This deteriorating sentiment picture doesn’t guarantee that the market will immediately stumble, of course. Contrarian analysis is not the only factor that propels the market, and even when contrarian analysis is on target, the market doesn’t always respond immediately. For example, stocks easily could rally in coming days — over the Santa Claus rally period through early January, as I indicated last week — before eventually succumbing to the gravitational pull exerted by excessive optimism.
Nevertheless, if the future is like the past, the U.S. market’s rally is increasingly living on borrowed time.
Mark Hulbert is a regular contributor to MarketWatch. His Hulbert Ratings tracks investment newsletters that pay a flat fee to be audited. He can be reached at mark@hulbertratings.com
More: The 10 days that moved the stock market the most in 2023
Also read: Ed Yardeni: 12 reasons stock investors will see the S&P 500 hit 5,400 in 2024