Wall Street professionals have proven once again that the higher U.S. stocks climb, the more bullish analysts become.
To wit, the latest reading from Bank of America Global Research’s popular sell-side indicator showed that Wall Street analysts’ outlook on the U.S. stock market brightened in June at the fastest clip since November 2022. The S&P 500 index capped off the first half of 2023 with its highest close in more than 14 months on Friday, while also cementing a gain of 6.5% for the month.
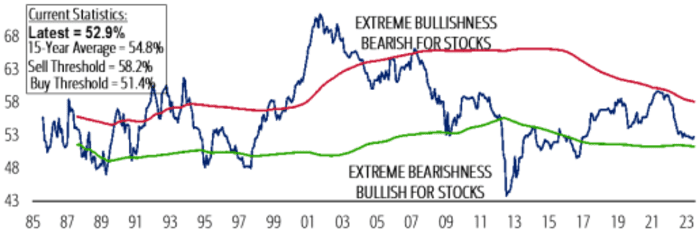
The average recommended allocation to equities made by analysts to their clients rose by 33 basis points to 52.9% last month, according to the indicator, which is maintained by Savita Subramanian, one of BofA’s top strategists.
She has described the sell-side indicator as a reliable counter-indicator, meaning that periods of intense bearishness often precede stock-market rallies, and vice versa.
BOFA
To be sure, plenty of Wall Street strategists, including JPMorgan Chase & Co.’s Marko Kolanovic, Morgan Stanley’s Michael Wilson, and even Subramanian’s BofA colleague Michael Hartnett, believe the rally will soon run out of steam.
However, enough professionals are agreed to keep the sell side indicator in bullish territory based on historical data compiled by Subramanian and her team. Right now, the indicator suggests stocks could rise by another 16% over the next 12 months.
“Despite the uptick in our SSI this month, sentiment remains just off of a six-year low,” Subramanian and her team wrote in a note shared with MarketWatch on Wednesday.
The S&P 500
SPX,
has already risen by that much since the start of the year, FactSet data show, as the artificial intelligence boom has inspired a rally in some of the megacap technology stocks that dominate the U.S. equity market. Stocks have also benefited as a widely expected recession has yet to materialize.
History shows that when stocks rise sharply during the first half, more gains typically follow during the second. Since 1929, the S&P 500 index has climbed an average of 4.3% during the second half after gaining at least 14% during the first six months of the year, Dow Jones Market Data shows.